# Use Jupyter Notebook with an Ontop SPARQL endpoint
This tutorial shows how to use a Python/Jupyter Notebook to interact with an Ontop SPARQL endpoint.
Link to the Jupyter Notebook: ontop-jupyter.ipynb
Assume that the endpoint is already set up and the URL is http://localhost:8080/sparql (opens new window).
# SPARQLWrapper
You can use the SPARQLWrapper library (opens new window) to send SPARQL queries and get results. The following code gets the result as JSON documents and convert it to a Python dict object.
from SPARQLWrapper import SPARQLWrapper, JSON
q = """
  PREFIX : <http://example.org/voc#>
  PREFIX foaf: <http://xmlns.com/foaf/0.1/>
  SELECT ?lname ?title
  WHERE {
    ?attendee foaf:lastName ?lname ; :attends ?course .
    ?course :title ?title .
  }
"""
sparql = SPARQLWrapper("http://localhost:8080/sparql")
sparql.setQuery(q)
sparql.setReturnFormat(JSON)
results = sparql.query().convert()
print(results)
Running the code above yields the following output (JSON indentation added for clarity):
{
   "head":{
      "vars":[ "lname", "title" ]
   },
   "results":{
      "bindings":[ {
         "lname":{ "type":"literal", "value":"Robards" },
         "title":{ "type":"literal", "value":"Data Mining" }
      }, {
         "lname":{ "type":"literal", "value":"Smith" },
         "title":{ "type":"literal", "value":"Operating Systems" }
      }, {
         "lname":{ "type":"literal", "value":"Doe" },
         "title":{ "type":"literal", "value":"Linear Algebra" }
      }, {
         "lname":{ "type":"literal", "value":"Combs"  },
         "title":{ "type":"literal", "value":"Operating Systems" }
      }, {
         "lname":{ "type":"literal", "value":"Doe" },
         "title":{ "type":"literal", "value":"Analysis" }
      }, {
         "lname":{ "type":"literal", "value":"Hinkley" },
         "title":{ "type":"literal", "value":"Data Mining" }
      }, {
         "lname":{ "type":"literal", "value":"Robards" },
         "title":{ "type":"literal", "value":"Research Methods" }
      }, {
         "lname":{ "type":"literal", "value":"Smith" },
         "title":{ "type":"literal", "value":"Analysis" }
      }, {
         "lname":{ "type":"literal", "value":"Smith" },
         "title":{ "type":"literal", "value":"Linear Algebra" }
      }, {
         "lname":{ "type":"literal", "value":"Combs" },
         "title":{ "type":"literal", "value":"Linear Algebra" }
      }, {
         "lname":{ "type":"literal", "value":"Hinkley" },
         "title":{ "type":"literal", "value":"Theory of Computing" }
      }, {
         "lname":{ "type":"literal", "value":"Alfaro" },
         "title":{ "type":"literal", "value":"Introduction to programming" }
      }, {
         "lname":{ "type":"literal", "value":"Hinkley" },
         "title":{ "type":"literal", "value":"Software factory" }
      }, {
         "lname":{ "type":"literal", "value":"Mendez" },
         "title":{ "type":"literal", "value":"Software factory" }
      }, {
         "lname":{ "type":"literal", "value":"Mendez" },
         "title":{ "type":"literal", "value":"Software process management" }
      }, {
         "lname":{ "type":"literal", "value":"Moses" },
         "title":{ "type":"literal", "value":"Information security" }
      }, {
         "lname":{ "type":"literal", "value":"Moses" },
         "title":{ "type":"literal", "value":"Discrete mathematics and logic" }
      } ]
   }
}
# Pandas DataFrame
You might want to convert the SPARQL results to a pandas DataFrame for data analysis. The library sparql-dataframe (opens new window) is handy for this.
import sparql_dataframe
endpoint = "http://localhost:8080/sparql"
q = """
    PREFIX : <http://example.org/voc#>
    PREFIX foaf: <http://xmlns.com/foaf/0.1/>
    SELECT ?lname ?course_title
    WHERE {
      ?attendee foaf:lastName ?lname ;
          :attends ?course .
      ?course :title ?course_title .
    }
"""
df = sparql_dataframe.get(endpoint, q)
The result df can be manipulated as any Pandas DataFrame. For instance:
df.head()
| lname | course_title | |
|---|---|---|
| 0 | Robards | Data Mining |
| 1 | Smith | Operating Systems |
| 2 | Doe | Linear Algebra |
| 3 | Combs | Operating Systems |
| 4 | Doe | Analysis |
df.describe()
| lname | course_title | |
|---|---|---|
| count | 17 | 17 |
| unique | 8 | 11 |
| top | Smith | Linear Algebra |
| freq | 3 | 3 |
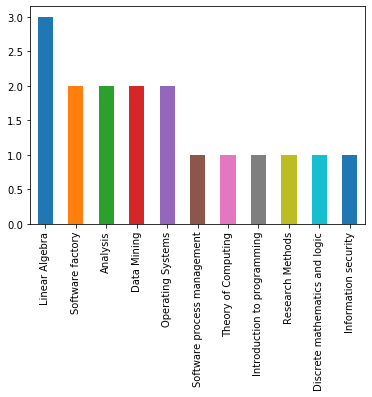
df['course_title'].value_counts().plot(kind='bar')
<matplotlib.axes._subplots.AxesSubplot at 0x11475ebd0>